This article was co-authored by Joe DeStefano, Ben Piper, and Jonathan Stern and benefitted from input from Chris Cummiskey and Tim Slade. It was originally published on the RTI ShareEd website on 21 April 2020. Part II can be read here.
Several recent blog posts have raised the issue of COVID-19 related disruptions to schooling around the world and how this will impact student learning. All agree that the closing of schools will negatively affect students’ academic progress. But these blogs and related commentary raise some compelling questions, that are only just beginning to be answered.  How much learning loss will children experience? How inequitably will that loss be felt? How does the magnitude of the anticipated learning loss determine what remedial strategies should be deployed once schooling restarts? Will the timing of the interruption – whether at the beginning, middle or end of a school year – lead to different kinds of challenges in terms of the amount of lost learning and in terms of how best to make up for it? And should ministries of education and their development partners make appropriate adjustments to their indicator targets to account for the inevitable crisis-related decreased performance of teachers and students?
A team from RTI International are asking these same questions and setting out to have evidence-based, data-driven answers.
In a blog posted on April 9, NWEA uses measures of summer learning loss drawn from their vast database of U.S. assessments from the beginning and end of school years to model how much student reading and math achievement may decline due to the COVID-19 related school closures. They indicate that even a 3-month school closure could result in students being nearly an entire school year behind what would be expected in normal conditions. In the past few weeks, the World Bank, IDB and CGD also posted blogs emphasizing how the interruption to the school year will most likely further exacerbate the pre-existing inequities in learning outcomes prevalent in most systems. These issues range from poorer students and marginalized groups having less access to distance learning opportunities to low-income students experiencing greater learning losses while out of school than their high-income counterparts (arguably due in part to the lack of access to basic inputs for homeschooling) to evidence from prior crises which show that disadvantaged and minority children, as well as girls are typically the most adversely affected by school closures (including increased dropouts and inequitable supply-side reductions in opportunities for those most in need).
These are all points we also wish to emphasize and use data to inform. However, most of the analyses we have seen are relying heavily on U.S. or other OECD data to gauge the impact of a disruption to the school year. RTI has a large number of datasets from early grade reading assessments (EGRA) conducted across low and middle income countries.
We plan to use an analytical approach that will allow us to meet two main objectives.
- We want to inform plans for reopening school so that instructional strategies can be adjusted to meet the remedial requirements of students as they return to class, and in particular to recognize that students from poorer, more rural, and otherwise disadvantaged families will need even greater, targeted support to catch up.
- We want to help ministries of education and their programs make realistic adjustments to the targets for learning improvement that they previously anticipated achieving.
Given these two objectives, we are conducting analyses that use existing learning data from LMICs to examine the following:
- Measures of learning in two successive grades is a way to estimate the amount of year-on-year growth in student reading achievement under normal conditions. As a starting point, data from the following countries can be used to make these estimates: Jordan, Egypt, Philippines, Nepal, Kenya, Tanzania, Uganda, Malawi.
- Measures of impacts that were being achieved in education programs prior to the COVID-19 pandemic, focused on early grade reading outcomes primarily (for example, from midline and end line evaluations), in order to separately estimate treatment and control gains over time. Jordan, Nepal, and Uganda.
- Analysis of summer learning loss using data from LMICs. This includes our paper from Malawi, which showed that the pattern of summer learning loss is similar in Malawi as it is in the US. (Slade et al. 2017)
- Information from specific countries on the amount of school time likely to be missed, as well as an indication of which countries are experiencing school closures during the beginning, middle or end of the school year.
- Information on the crisis-response strategies being deployed – the media through which learning resources are being made available, as well as data on the reach and degrees of access to those media among different segments of the population within countries. Even countries that worked quickly to create online learning opportunities need to consider how those opportunities are contributing to inequities
For example, Kenya is known for a rapid response to the crisis by putting lessons for its children on television and radio. Given access to television and radio in urban and rural Kenya, the average Grade 1-3 child has 4.1 minutes of literacy instruction available per day in Kiswahili and English combined. Given that the TV and radio schedules change frequently, we estimate that even the most conscientious parents are likely able to have their children access only a minute or two of teaching per day.
As NWEA has done with the data they were able to access, and the Bank has done heuristically, we will use the above sets of information to model different possible reduced levels of learning for students who were at different points along the learning achievement distribution prior to the present disruption to their schooling.
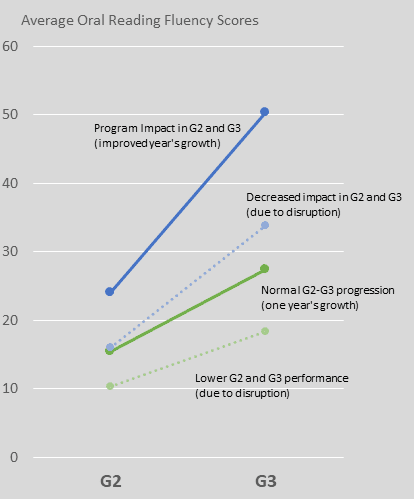 We would like to model how the duration of school closings, coupled with the probabilities of different students being able to access any learning opportunities during the disruption, factor into the amount of learning achievement that will need to be made up once teachers and students can begin attending school again.
The graph shown here gives a very preliminary indication of the way in which we would expect to show how the reading proficiency of all students may be impacted by the learning lost due to the school closure (the green lines in the chart). It shows an estimate of how an intervention that had produced a certain level of impact prior to the pandemic, would also need to adjust its expectations for impact given the lost opportunities to learn associated with school closures (blue lines). For simplicity of depiction, only averages are modeled in this chart. A more interesting (and challenging) analysis will be an estimation of how students along the full distribution of reading ability will be impacted.
We are using this blog to invite those who are interested in this kind of analysis, and who may have data sets than can contribute to it, to reach out to any of the RTI team mentioned below. Specifically, we are looking for representative (national or otherwise) data from at least two consecutive grade-years (grade 1 and grade 2 or grade 2 and grade 3) that measured student’s reading ability (such as EGRA or PIRLS).

